UMD Report Examines Schools with High Suspension Rates in Maryland
Report Finds Disproportionate Levels of Suspensions for Students with Disabilities and Black Students
Tuesday, October 30, 2018
Media Contact: Audrey Hill, audreyh@umd.edu or 301-405-3468
College Park, MD—A new report by University of Maryland researchers on schools in Maryland with high suspension rates—defined as suspending 25 percent or more of students in a subgroup—examines factors that relate to high rates of exclusionary discipline at the school level. At the elementary and secondary school level, researchers found that students with disabilities and black students were disproportionately suspended in Maryland.
Of the 196 public schools in Maryland, 14 percent were identified as “high suspending schools,” in the analysis, which analyzed rates based on categories of race/ethnicity (Asian, Hispanic, Black, White, and other races), English Learners, and students with disabilities (SWD). Researchers found that high suspending schools were located across the state in both rural and urban areas, and small and large districts. Twenty-two of 24 school districts in Maryland had at least one high suspending school.
Researchers also found variability within a school district and across the districts in the number of schools that had high suspension rates.
“The variation in suspension rates suggests that the school and district a child goes to makes a difference, as some schools are doing things differently in how they handle discipline,” said Gail L. Sunderman, director of the Maryland Equity Project at the UMD College of Education and co-author of the report. “In some school districts, more than 40 percent of secondary schools were high suspending, which indicates a need for more support in terms of training, leadership or culture change to address exclusionary discipline.”
Major findings of this report include:
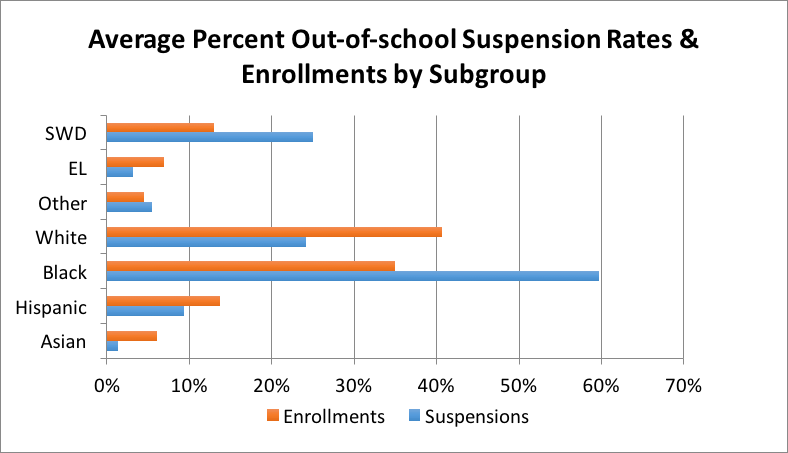
- Close to 60 percent of out-of-school suspensions are of Black students, even though Black students make up only 35 percent of public school enrollment in Maryland. (See Figure 1.)
- Students with disabilities represent 13 percent of enrollment in Maryland public schools but 25 percent of out-of-school suspensions.
- School suspension rates for Black students are twice as high as rates for White students.
- The highest school suspension rate is for students with disabilities, with schools suspending on average 9.5 percent of their students with disabilities.
- Schools with higher enrollments of Black students, students with disabilities, and low-income students and lower enrollments of White, Asian and Hispanic students suspended more students across multiple subgroups.
- High suspending schools were less successful academically, had lower graduation rates, lower attendance, higher mobility, and fewer experienced teachers. In other words, these were struggling schools across multiple indicators.
“Our analysis found clear evidence of disparities in suspension rates in Maryland schools,” Dr. Sunderman said. She recommended that educators and policymakers investigate the reasons for the disparities in exclusionary discipline, which has long-term consequences for student success.
Figure: Average percent of out-of school suspensions and enrollment by subgroup, 2011, 2013, & 2015
“Extensive research on the short and long-term consequences of suspensions shows that it leads to lower academic performance, a higher dropout rate, and increased risk of contact with the juvenile justice system,” said Dr. Sunderman. “Being suspended is detrimental to students’ life prospects. When thinking about school reform, keeping kids in school would really help in improving performance and may reduce the achievement gap. When you’re not in school, you’re not learning.”
Researchers also found that secondary schools were more likely to be high suspending than elementary schools in Maryland. White, English Learners, Hispanic and Asian students were not disproportionately suspended in Maryland, according to the MEP report.
The MEP report analyzed data on suspensions from the U.S. Department of Education’s Civil Rights Data Collection (CRDC), averaging rates across 2011-12, 2013-13, and 2015-16. Data on school-level variables was derived from the CRDC, as well as from the 2013 Maryland School Report Card that is provided by the Maryland State Department of Education website. The report was co-authored by Robert Croninger, an associate professor at the University of Maryland College of Education and co-director at MEP.
Full report: High Suspending Schools in Maryland: Where are They Located and Who Attends Them?